Download this article (PDF) 394 KB

Search for “best message broker” and you get a leaderboard: throughput numbers, a winner, a chart. That leaderboard will not help you. The brokers on it were tested on someone else’s hardware, someone else’s network, someone else’s acknowledgment settings. Your control loop has none of those in common.
I have run these benchmarks myself, for a real-time control system with a hard latency budget. The broker that won on paper was not the one that mattered. What mattered was a handful of decisions that had nothing to do with the leaderboard. Here is the framework I use instead.
Start with your constraint, not a chart
Before comparing brokers, write down three numbers: your end to end latency budget, the message rate you actually need, and how much data loss you can tolerate during a failure. Most teams skip this step and go straight to a comparison table. Then they discover, mid-project, that their real constraint was never throughput. It was tail latency under load, which almost no public benchmark measures honestly.
A platooning control loop and a fleet telemetry pipeline can both call themselves “IoT,” and need completely different brokers. One needs single-digit millisecond response with a small message payload. The other needs to survive a flaky cellular link and can tolerate a few seconds of delay. Naming your actual constraint first turns “which broker is best” into “which brokers even qualify,” which is a much shorter list.
Acknowledgment mode decides more than broker choice
Acknowledgment mode decides more than broker choice: in a failure I measured directly, a broker configured with publisher acknowledgments off and consumer acknowledgments on looked fine in a light test. Under real load, with a single consumer, mean latency went from sub-millisecond to several minutes. Not a typo: minutes. The publisher kept accepting messages faster than the one consumer could drain them, the queue backed up, and every new message waited behind an ever-growing backlog.
The instinctive fix, add a second consumer, only worked because I also checked that consumer throughput could match the publisher’s rate. In a later test with a stricter prefetch setting, two consumers were still not enough. It took four before latency came back to normal. The lesson is not “add more consumers.” It is: your aggregate consumer throughput has to meet or beat your publisher throughput, and a low prefetch or QOS setting can quietly break that even when the consumer count looks sufficient on paper.
None of this shows up in a vendor benchmark, because vendor benchmarks tune every setting for the best possible number. Your production system will not be tuned that carefully on day one. Test your actual acknowledgment mode, your actual consumer count, and your actual prefetch setting before you trust any latency number, including mine.
A little packet loss is not a little more latency
Fixed network delay and network jitter or packet loss are two different problems, and treating them as one is a common mistake in broker evaluations. Add a constant 20ms of delay to a link and latency shifts up by roughly 20ms, uniformly, with delivery staying near 100%. That is easy to plan for.
Add loss or jitter instead, and the shape of the problem changes entirely. In one broker I tested, just 1% simulated packet loss raised p99 latency by roughly 6x. Push the jitter higher and mean latency can balloon by three orders of magnitude while delivery success drops well below two thirds. A fixed delay is a shift. Loss and jitter are a long tail, and a long tail is what breaks a real-time control loop, not the average.
If your evaluation only injects fixed delay, you are testing the easy case. Cellular links, congested Wi-Fi, and shared infrastructure links produce jitter and loss, not clean fixed delay. Test the failure mode you will actually see in the field.
When even the fastest broker is too slow
Below a certain latency floor, message brokers stop being the right tool at all. This is the corner the game industry solved years ago, for the same reason: a competitive shooter cannot wait for a TCP retransmit any more than a vehicle control loop can.
I have worked on a project with exactly this shape outside gaming: an edge to vehicle safety system with servers distributed along highways, each one owning every vehicle currently inside its coverage area and handing that vehicle off to the next server as it drives out of range. Each edge server pushed urgent safety and control messages to the vehicles it owned and ingested their position and speed in return. The original target for that loop was under 20 milliseconds end to end, tighter than most competitive online games run over the public internet. It was later relaxed to a working budget of under 100 milliseconds with a 10 millisecond clock tick, once benchmarking showed the tighter number was not achievable without disproportionate engineering cost. Strip away the graphics and that is a multiplayer game server: an authoritative node tracking moving clients, broadcasting time critical updates back to them, and handing a client off to a neighboring server as it moves out of range. That is exactly why I brought the game industry’s own solutions to this problem into a presentation on that project.
The game industry’s answer was to drop the broker entirely for the hottest path and use a UDP based protocol instead: GameNetworkingSockets, ENet, KCP, or increasingly QUIC, sometimes with client side prediction and server reconciliation to hide the remaining latency. See Gaffer On Games for the reference series on client side prediction, server reconciliation, and deterministic lockstep.
For IoT specifically, the equivalent move is not a bespoke UDP protocol, it is MQTT SN or CoAP over UDP for the last hop to the device, with a conventional broker only above that layer for aggregation and durability. You get a broker’s operational tooling where you need it, and none of its overhead on the segment where every millisecond counts.
This is a corner case, not a default. Most systems that think they need this level of latency actually need better acknowledgment settings, not a new transport protocol. Confirm you have exhausted the broker level options in this framework before you take on the operational cost of a custom UDP protocol.
What the game industry already solved
What the game industry already solved is the problem of hitting a frame budget while human reaction time runs two orders of magnitude slower than it. The clearest illustration of why milliseconds matter this much comes from Benjamin Goyette’s GDC 2016 talk for Activision, Fighting Latency on Call of Duty: Black Ops III. Slide 3 lines up human reaction time against a single frame budget:
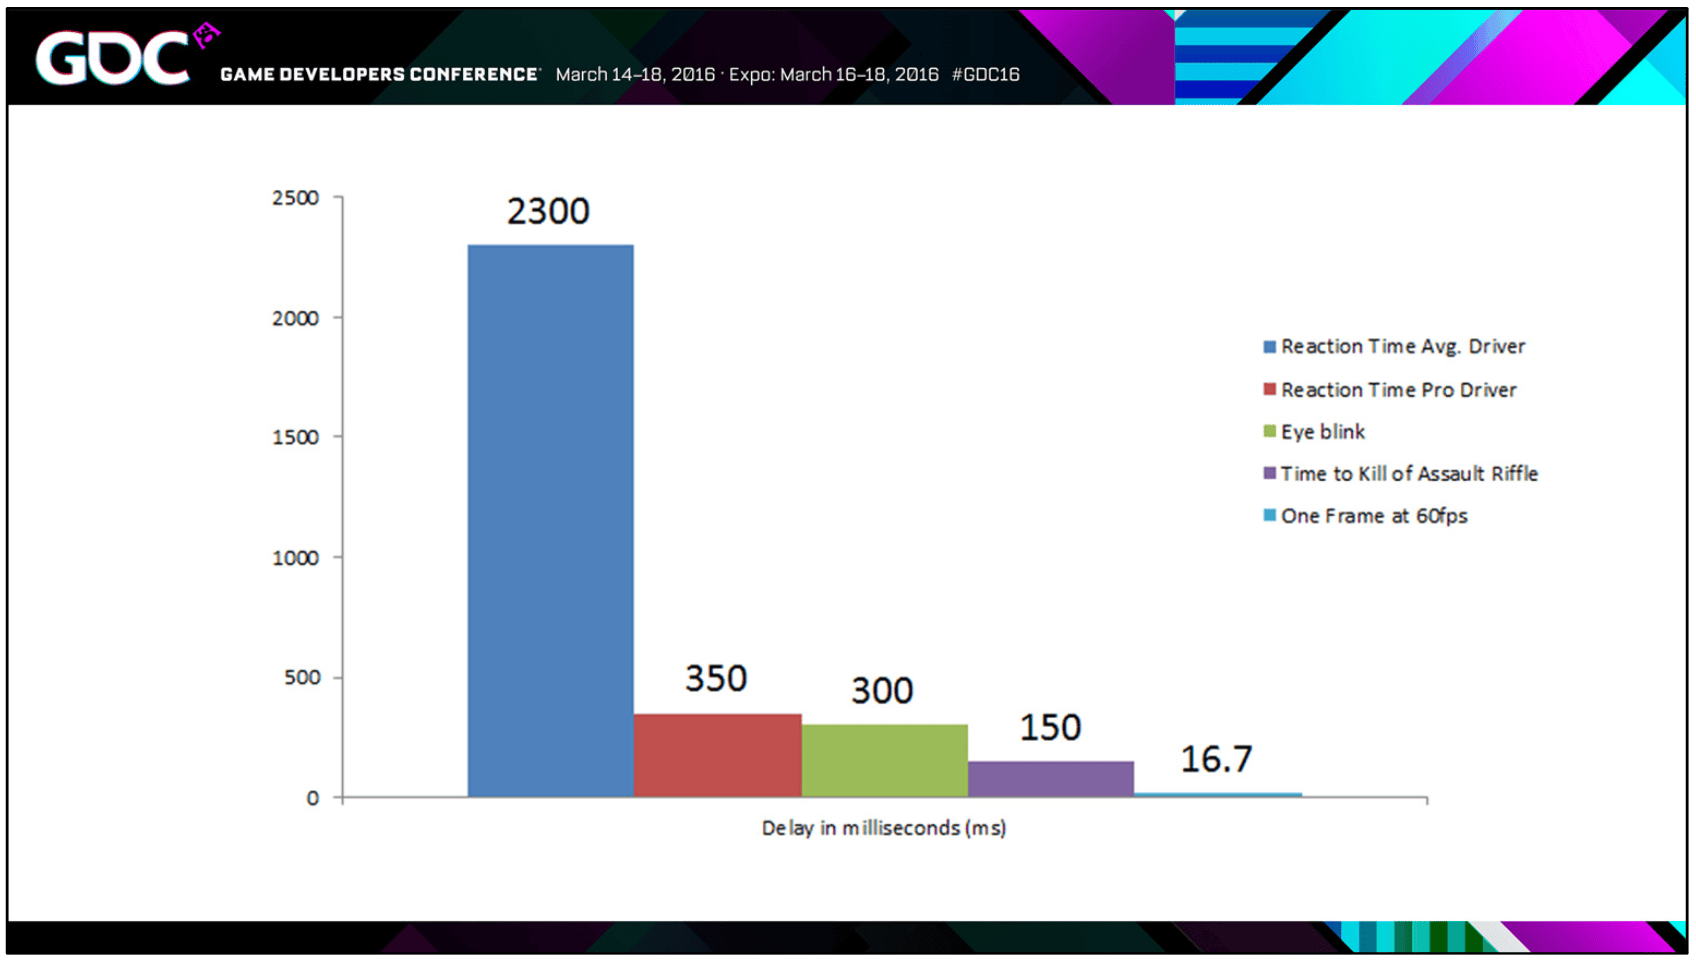
In text form:
- Average driver reaction time: 2300ms
- Professional driver reaction time: 350ms
- Eye blink: 300ms
- Time to kill with an assault rifle: 150ms
- One frame at 60fps: 16.7ms
A player’s reaction time is two orders of magnitude slower than the frame budget a shooter has to hit. Client side prediction, server reconciliation, and lag compensation exist to hide network latency inside that gap, not to eliminate it. Your control loop rarely gets a gap that generous, which is why this framework starts with your own constraint rather than borrowing a game engine’s numbers.
Further reading on the game industry techniques cited above:
- Gabriel Gambetta, Client-Server Game Architecture: an accessible introduction to why the server must stay authoritative and how client side prediction fills the gap.
- IT Hare, MMOG: RTT, Input Lag, and How to Mitigate Them: a practical breakdown of round trip time budgets for massively multiplayer games.
- Kasenides and Paspallis, A Systematic Mapping Study of MMOG Backend Architectures: a peer reviewed survey of backend architecture patterns across published MMOG research.
- Kislyuk and Zhai, Stanford CS244B project report: a systems course project analyzing spatially sharded game server architectures.
- Behnke, PhD thesis, HAW Hamburg Ubiquitous Computing group: doctoral research cited alongside the above on distributed real time networked systems.
IoT native brokers versus general purpose ones
RabbitMQ, Apache Pulsar, and Apache Kafka were not built for IoT device fleets. They were built for application messaging and data streaming, and they work well for IoT when your devices behave like well connected clients. MQTT native brokers exist for a different problem: hundreds of thousands of intermittently connected devices, with last will and testament messages, retained state, and connection semantics designed around flaky links from the start.
The decision is not which broker is more modern. It is whether your devices need those specific IoT semantics, and which MQTT native broker fits your deployment shape:
- HiveMQ: best for enterprise scale MQTT deployments that need built in clustering, monitoring, and vendor support.
- EMQX: best for very large device fleets that need to scale past tens of millions of concurrent connections.
- Eclipse Mosquitto: best for low resource environments, single devices, and simple deployments.
- NanoMQ: best for high performance edge computing and modern networking protocols.
- VerneMQ: best if you specifically require an open source Erlang clustering broker, keeping in mind its maintenance status.
A fleet of industrial sensors with unreliable connectivity and thousands of endpoints benefits from an MQTT native broker’s device management model. A handful of edge controllers with a stable network link and a strict latency budget usually do not need it, and will pay for those semantics in latency they cannot afford.
A short checklist instead of a leaderboard
This short checklist eliminates options faster than a benchmark chart will, so work through it in order instead of shopping a leaderboard. The five questions nail down your latency budget and how much of it the broker may consume, your tolerance for message loss during a failure, whether your links carry fixed delay or real jitter and packet loss, and what you have actually tested under real load. Answer them before you compare product names.
- What is your actual end to end latency budget, and what fraction of it can the broker consume.
- What is your tolerance for message loss during a failure. This decides your acknowledgment and queue durability settings before it decides your broker.
- Will your devices see fixed delay only, or realistic jitter and packet loss. Test the one you will actually face.
- Do you need MQTT native device semantics (last will, retained state, huge device counts), or is that overhead you do not need.
- Have you tested your actual consumer count and prefetch setting under your actual load, not the vendor’s tuned demo.
Answer these five and most teams find the broker choice was never really the hard part. The hard part is measuring your own system honestly before you commit to one.
If you are mid-way through this kind of evaluation and want a second opinion on the results, a short expert call is often enough to catch the acknowledgment mode or prefetch setting that is about to blow up your tail latency. For a fuller review of a data platform under a hard latency or reliability constraint, see the data platform performance audit.
Frequently asked questions
Which broker should I choose for an IoT deployment?
Start from your constraint, not a leaderboard. Write down your end to end latency budget, your real message rate, and the data loss you can tolerate during a failure. If you need last will messages, retained state, and hundreds of thousands of intermittently connected devices, an MQTT native broker such as HiveMQ, EMQX, Mosquitto, NanoMQ or VerneMQ fits. A handful of well connected edge controllers with a strict latency budget usually does better on RabbitMQ, Pulsar or Kafka, or on no broker at all.
What latency can a message broker actually deliver in production?
Sub-millisecond numbers from light tests do not survive real load. I measured a system where publisher acknowledgments off and consumer acknowledgments on drove mean latency from sub-millisecond to several minutes once the single consumer fell behind the publisher. Test your actual acknowledgment mode, consumer count and prefetch setting under your actual load before you trust any latency figure, including mine.
Why did adding a consumer not fix my queue backlog?
Because the fix only works if aggregate consumer throughput meets or beats publisher throughput. In one of my tests, a stricter prefetch or QOS setting left two consumers insufficient, and it took four before latency returned to normal. Check the aggregate drain rate first, then the consumer count.
Is packet loss worse than fixed delay for real-time control?
Yes, because the shapes differ. A constant 20ms delay shifts latency uniformly and leaves delivery near 100 percent. In one broker I tested, 1 percent simulated packet loss raised p99 latency by roughly 6x, and higher jitter ballooned mean latency by three orders of magnitude while delivery dropped below two thirds. Test jitter and loss, not only fixed delay.
When should I skip the broker and use UDP?
Below a certain latency floor, brokers stop being the right tool at all. The game industry solved this years ago with UDP transports such as GameNetworkingSockets, ENet, KCP and QUIC, plus client side prediction. For IoT, the equivalent move is MQTT SN or CoAP over UDP on the last hop to the device, with a conventional broker above that layer for aggregation and durability. Treat it as a corner case and exhaust the broker level options in this framework first.
Which MQTT broker scales to millions of devices?
It depends on the deployment shape. HiveMQ targets enterprise deployments that need built-in clustering and vendor support, EMQX targets very large fleets past tens of millions of concurrent connections, Mosquitto suits low resource environments and simple deployments, NanoMQ targets edge computing, and VerneMQ offers open source Erlang clustering with a maintenance status worth checking.
Update 2026-09-29. This post is now part of Event Mechanisms for Data Platforms, the field guide to event mechanisms for data platforms.
0 Comments