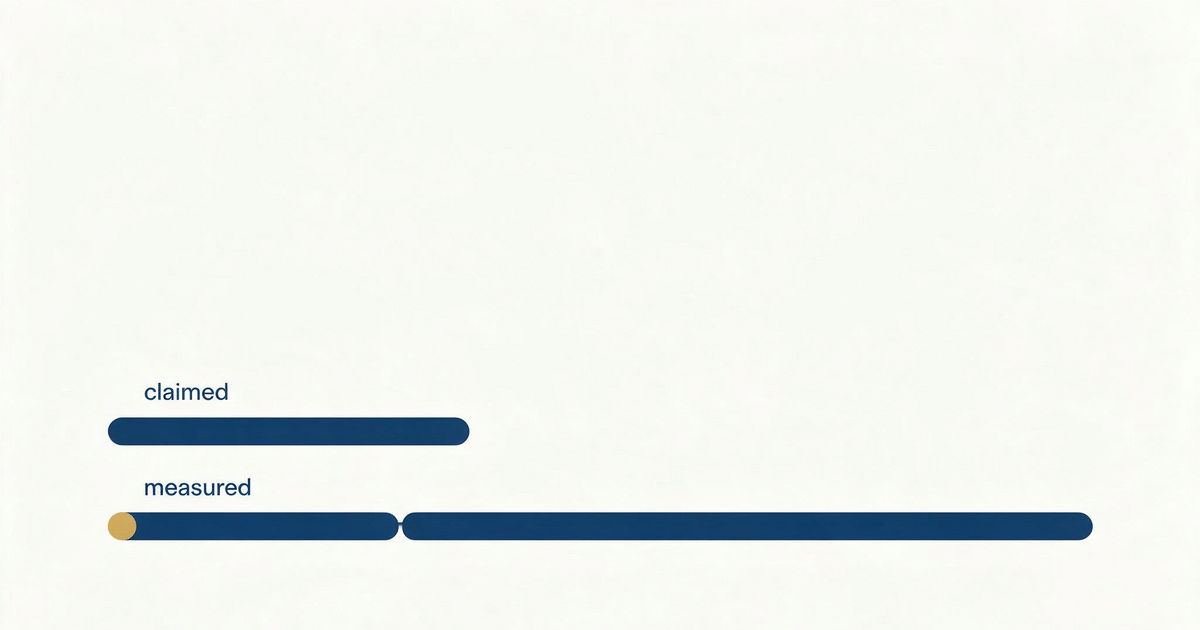
Every disaster recovery document states an objective in minutes and megabytes. Every replication architecture delivers something else: a convergence time, a single-copy window and a failed tail that waits for a background scan. This guide maps what actually decides your RTO and RPO on a data platform, from the semantics of replication to the observability that proves it works. It collects what the resilience posts on this blog established across production MinIO and S3-compatible platforms; each section states the mechanism and links to the post that proves it.
The one-line version: replication is a mirror, not a consensus; your real RPO is a reconciliation time; and failures here are quiet, so the evidence has to be measured, not documented.
RTO and RPO, defined once
The recovery point objective is the worst-case window of data loss at the moment of failure. Not the average lag. Not the replication delay on a good day. The worst case, including everything the platform does after the retry queue gives up.
The recovery time objective is the time to restored service, measured from a declared start event to a verified client operation. It includes detection, escalation, human decisions, DNS, certificates and dependency ordering, not just storage failover.
A defensible DR section names its boundaries instead of hiding them. It states the scope of the objective, the steady-state RPO, the degraded RPO, the single-copy window (and what serves as the source of truth while it is open), the failed-tail RPO, the RTO for a single-site loss, the RTO for an integrity-critical failover, the split-brain stance, and the promotion steps for a DR peer. The MinIO site replication RTO and RPO analysis works this template end to end against a real product, and the generic method for testing each clause is in how to test the recovery path.
Replication is a mirror, not a consensus
Cross-site replication in the S3-compatible world is an asynchronous mirror with availability semantics. A local write succeeds on local erasure-code quorum even when every peer is partitioned away. Quorum exists inside one cluster only. Conflicts reconcile by last writer wins on object timestamps, which means clock discipline is part of your durability model whether or not you wrote it down.
Versioning is mandatory at setup, and it multiplies the namespace (a point the next section pays for).
Topology costs money too. A full mesh means N sites carry N times N minus one over two links: three sites roughly double the egress per write against two, and five sites cost about four times. Synchronous mode does not change the semantics. It only moves the ACK: the source waits for the peer, pays the inter-datacenter round trip on every PUT (throughput drops by 3x to 5x at the same concurrency), and still ACKs when the peer is down, leaving the object marked pending. The honest statement is the one that decides most designs: an ACKed but unreplicated object exists in exactly one place. The queue of those objects lives only on the source, as per-object markers in the metadata envelope. No journal, no index, and no way for the peer to enumerate what it is owed. The backlog at any moment is roughly the write rate times the 99th percentile replication lag: at 1,000 writes per second and 5 seconds of lag, about 5,000 objects exist on one site only.
The convergence clock decides your real RPO
Each failed replication attempt climbs a short ladder: a few worker retries plus re-attempts from the most-recently-failed queue, on the order of four attempts spread over 15 to 20 minutes. After the last attempt there is no timer at all. The object wakes up when the background scanner reaches it or when an incidental read touches it. That single fact converts your RPO from a retry interval into a namespace walk.
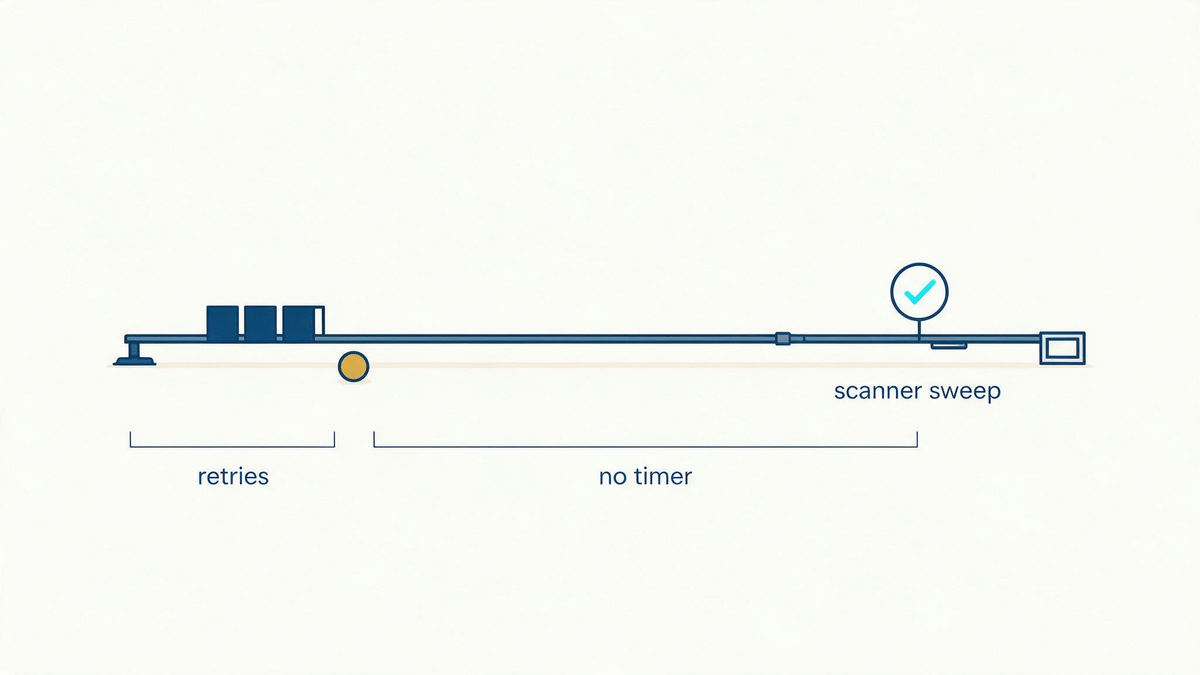
So the rule that should sit in every DR document: for the failed tail, the replication RPO equals one full scanner sweep. Unreconciled backlog in steady state is roughly the hard failure rate times the scan period: 10 hard failures per day against a 7-day sweep leaves about 70 objects permanently out of sync. On a small namespace a sweep takes hours. On a large one, with tens or hundreds of millions of objects, a sweep takes days to weeks, and that is the number your RPO actually is. This is why object count, not bytes, is the durability axis: the same metadata multipliers that make small objects expensive make the repair clock long. What happens to the objects that fall off the fast path is the subject of the replication drops nobody reads.
When replication overshoots: loops built from stacked features
Too much can amplify without bound. Too little replication leaves a single-copy window. The measured case: a three-site mesh generated 706 million replication requests in 48 hours, about 4,100 per second, of which 684 million were HTTP 405 responses carrying no data.
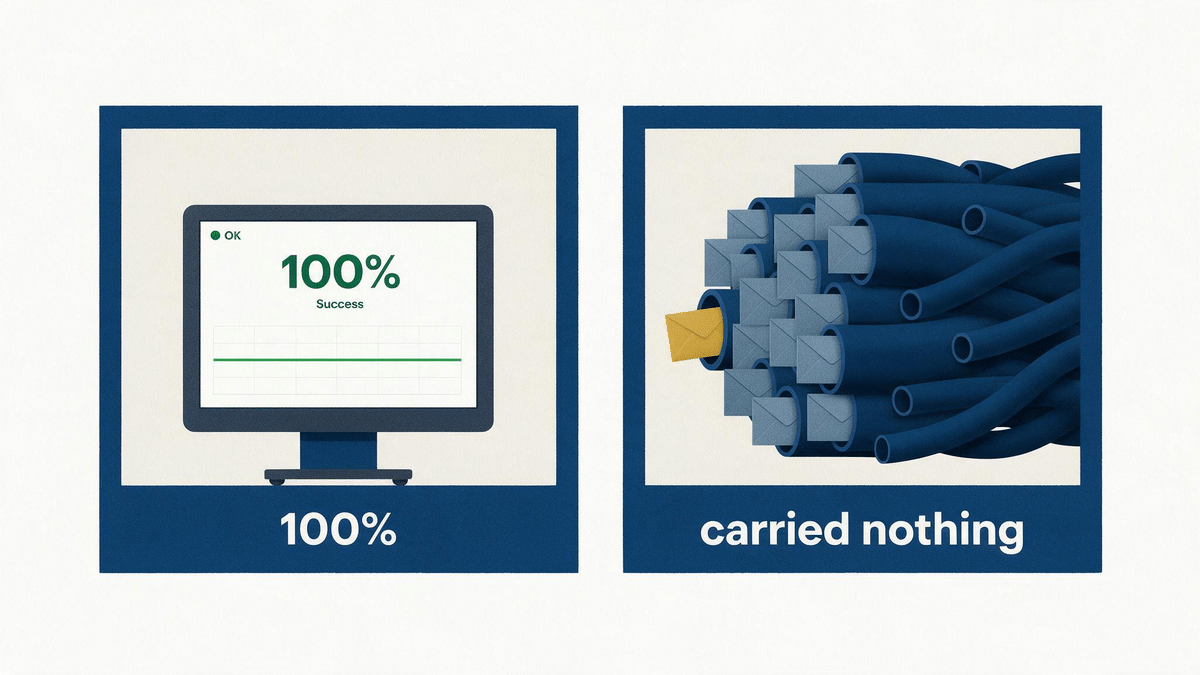
96.8 percent of the replication traffic was noise, 60 percent of cluster CPU served it, and every dashboard stayed green while about 20 million delete-marker versions sat stuck in a retry loop the code counted as success.
Four ingredients had to stack: site replication, lifecycle version-purge rules, tens of millions of versions, and a fast scan cadence. Remove any one and the symptom is invisible. The topology law is the same as everywhere else in distributed systems: with two peers a first delivery almost always succeeds; with three or more, every failed first delivery builds a permanent pending entry. The 684 million 405s post carries the measurement, the detection query and the stopgap. How the Silo fork fixed the delete-marker loop carries the three retry-side defects and the fix. The structural lesson is older than the bug: run the smallest feature surface that satisfies the requirement, and treat every new feature as a multiplier on the namespace walk.
Observability that does not lie
Replication failures are quiet, so the signals you trust have to be audited like everything else. The practical layer that survives all of this: split replication traffic from client traffic at the proxy by user agent and give each its own error-rate panel, alert on response-code distribution shapes instead of raw non-2xx counts. Four findings from the source code and the incidents, all of them counter-intuitive:
- A 405 on a delete-marker probe is the success path. Exclude it from error rates. But watch its volume shape: occasional single-round probes are healthy, a floor that never decays is stuck stock.
- Retried throttles are invisible. A 429 that succeeds on retry leaves no metric and no log line inside the product. The only record is at the proxy. Watch it there.
- The drop counter reads zero forever on stock Community Edition. Overflow entries are counted into a field nothing reads. Do not build an alert on it.
- The backlog gauge is not a failure count. It is the size of the most recent flush, and it cannot separate objects that failed from objects never attempted.
Track scanner cycle time as the recovery bound, and sample per-object replication status on a set of keys as the only ground truth that does not pass through the aggregate counters. The full signal table and the worker-priority findings are in the counter nobody reads.
Architecture choices and the numbers you can publish
Asynchronous per-peer replication is the default for good reason: synchronous mode pays latency continuously (5 to 20 ms local becomes 25 to 80 ms plus the round trip) and buys nothing in the failure cases that matter, because the source still ACKs when the peer is down. With the model in place, the choices are few and the trade-offs are honest.
If you need read-after-write across sites, proxy the read instead of synchronizing the write. If regulation names synchronous replication, enable it as a compliance decision and keep the honest clauses about peer-down behavior and the failed tail.
For the DR topology itself: active-active at the storage layer gives near-zero recovery time for a single site loss, with DNS and load balancer behavior included in the published RTO. Active-passive at the edge costs a few minutes of recovery time and buys a zero split-brain write window, which is the right trade for integrity-critical buckets. Plan the double-failure window explicitly: when the second site dies while the first is still draining, writes acknowledged during the partition may be invisible on the survivor. Keep versioning on and audit for suspended buckets, keep clock drift under 50 ms and alert above 100 ms, document the reconciliation procedure, and model the drain duration before the incident instead of during it. Peer endpoints go to a load balancer or multi-node name, never a single node.
Recovery has to be tested, not documented
None of the above is real until it has been measured under the failure scenarios you claim to survive. The method is a failure matrix matched to the objective’s boundary, a recovery clock that includes human decisions and dependency order, real restore throughput from the production backup path, data validation that does not stop at a process exit code, and an evidence packet another engineer can reproduce.
A replica that starts in five minutes may hold data older than the RPO; a backup that contains every committed record may take twelve hours to restore. Test the recovery path walks through the matrix, the clock and the evidence packet in full.
Two closing points that belong in the same document. First, convergence must be verified, not assumed: after an upgrade or a fix, watch purge statuses reach terminal states, watch the 405 floor decay, and diff a sample of version listings across sites. Second, the release channel is now part of your resilience posture. A frozen open-source line with unpatched advisories is a recovery risk like any other, and choosing between a maintained fork, a commercial line or a migration belongs in the DR document like any other dependency decision.
FAQ
What is the difference between RTO and RPO?
The RPO is the worst-case window of data loss at failure time: how far back recovered data may be. The RTO is the time to restored service, from a declared start event to a verified client operation, including detection, human decisions, DNS and dependency order. A platform can meet one and fail the other, so they are tested and reported separately.
Does synchronous replication protect my RPO?
Less than it appears. Synchronous mode adds the peer round trip to every write and drops throughput by 3x to 5x, but the source still ACKs when the peer is down and marks the object pending. The single-copy window shrinks toward zero only while every peer is healthy, and the failed tail after retries still waits for a full scanner sweep. Asynchronous replication with a proxy for read-after-write is the cheaper design in most cases.
Why does the DR plan say minutes when recovery takes days?
Because the plan usually prices the failover and forgets the reconciliation. Failed replication attempts stop retrying within minutes, after which only the background scanner wakes the objects, and one full sweep at production namespace size is often days. The failed-tail RPO equals one full scanner sweep, so the objective must be written against scan time and object count, not against the retry interval.
How do I know replication actually converged?
Verify three signals instead of trusting the success rate: per-target purge statuses reach terminal states rather than camping on pending, the 405 share of internal replication traffic decays to occasional probes instead of a floor that never moves, and a scheduled diff of version listings across sites on a sample of prefixes comes back empty. Aggregate dashboards can stay green while none of this is true.
Should the DR plan cover the software release channel?
Yes. A frozen release line with disclosed, unpatched advisories is a durability and recoverability risk of the same class as a failing disk. The plan should name the release channel, its support status, the exposure to known advisories and the migration or fork options, and revalidate the choice when the vendor situation changes.
Related posts
- MinIO site replication: sync mode will not save your RPO
- MinIO site replication bug: how 684 million HTTP 405s exposed the delete-marker loop
- MinIO delete-marker convergence: how the Silo fork fixed the 405 replication loop
- MinIO replication drops objects into a counter nobody reads
- RTO and RPO for data platforms: test the recovery path
If a resilience claim has to survive a board review or an incident, the scalability, reliability and disaster recovery engagement measures exactly this ground. A data infrastructure audit or a focused Expert Call is the usual starting point.
0 Comments