A scaling claim and a cost overrun are the same problem seen from two ends. Both come from a divergence between resources you reserved or billed and resources doing useful work, and both can be checked with arithmetic against numbers already in the report before anyone opens a profiler. This guide maps performance and cost engineering for data platforms: the two claim-checking laws, the measurement discipline that keeps numbers comparable, the three leak families where the money actually sits, and the path from a benchmark result to a hardware decision. It collects what the performance posts on this blog established; each section states the mechanism and links to the post that proves it.
The one-line version: check the claim’s internal feasibility first, measure against reservations second, and only then buy hardware or switch engines.
The claim-checking toolkit: two laws as filters
Two classical laws do most of the early work, and both run in minutes against figures a report already contains. Amdahl’s law turns any parallel speedup claim into the serial fraction it implies (the Karp-Flatt metric) and the ceiling that follows: 10 percent serial caps a 32-worker cluster at ten times, no matter what the vendor promises.
Compute the implied fraction at several cluster sizes: stable means a real ceiling, rising means coordination cost growing with the cluster, and past 100 percent the fixed-workload model is simply void. Gunther’s universal scalability law adds the coherency term that Amdahl cannot express, and a curve that peaks and declines retrograde is measurable before you reach the peak.
Little’s law does the same for reports of throughput, latency and concurrency: they are bound by one product within one boundary and one interval, so when the three do not reconcile, the report is mixing systems or windows. It also runs forward: a latency budget becomes a concrete in-flight population, and every pool (connections, workers, partitions, sockets) must hold its share. The utilization law closes the loop as an impossibility test: a throughput and service time that demand more than 100 percent of the servers you have is a self-falsifying report.
Measurement method beats leaderboard numbers
The laws filter claims; method decides whether the surviving numbers are comparable. Boundary and interval discipline first: all three of throughput, latency and concurrency must be measured at the same place over the same window, with ramp, steady state and drain reported separately and distributions (p50, p99, max, sample count) alongside any mean. Strong scaling and capacity scaling are different results and get separate labels, never one blended curve.
Benchmark choice is a regime decision. CPU-bound analytical suites answer one question; I/O-pressure end-to-end suites answer another, and no single benchmark captures how an engine behaves on your data. Run more than one, run them on your own workload, and tune the cluster, not the benchmark. That is the design stance of the modernized TPCx-HS stress test: a deliberately minimal, infrastructure-agnostic harness for Spark on object-storage stacks, explicitly not a certified submission. And read vendor cost claims with the same hygiene: the strongest engine claim I reviewed paired a real fourfold speedup with a quarter-sized instance to declare a 94 percent cost reduction, and said out loud that the figure is a best case assuming both gains hold at once.
Where the money sits: three leak families
Across the audits behind these posts, GPU compute overspend runs 35 to 60 percent, and it decomposes into three families with one anatomy: a reservation or a bill diverges from real usage, and the fix is architectural, not procurement. The GPU cost post maps the first two: data-pipeline starvation (GPUs at 30 to 50 percent utilization on I/O-bound workloads; a local NVMe cache layer with prefetch recovers 15 to 25 points of utilization).
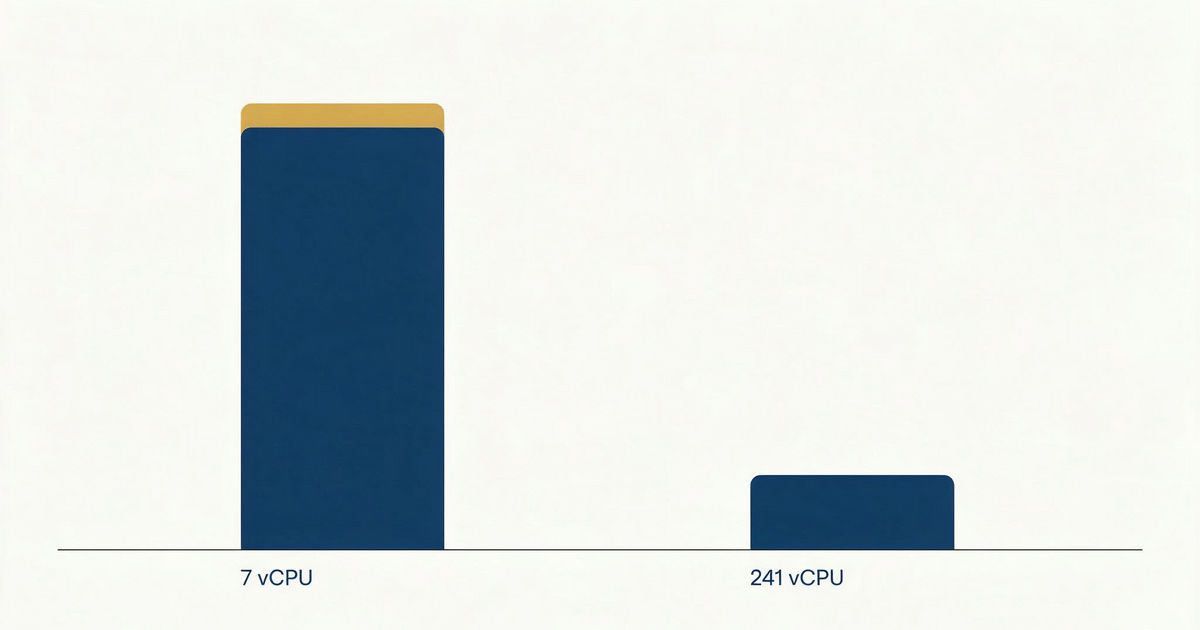
And inference overprovisioning (often twofold, with 60 percent of GPU memory reserved for a worst case that rarely arrives; right-sizing on a measured request-size distribution cuts inference spend 30 to 50 percent). The CPU reservation post maps the third on the scheduler side: Spark sets requests equal to limits, the cluster reserves about twice the CPU the jobs use, and executors sit pending on idle silicon until a mutating webhook rewrites requests to a fraction of limits.
Under the GPU leaks sits the data-movement story. As context windows grow, prefill increasingly dominates decode and cache behavior decides the regime: unstable hit rates collapse throughput and spike latency while the GPU idles. Storage is the bottleneck again is the essay form of that claim. The biggest gains rarely come from better models. They come from better data movement.
Utilization as an impossibility test on live platforms
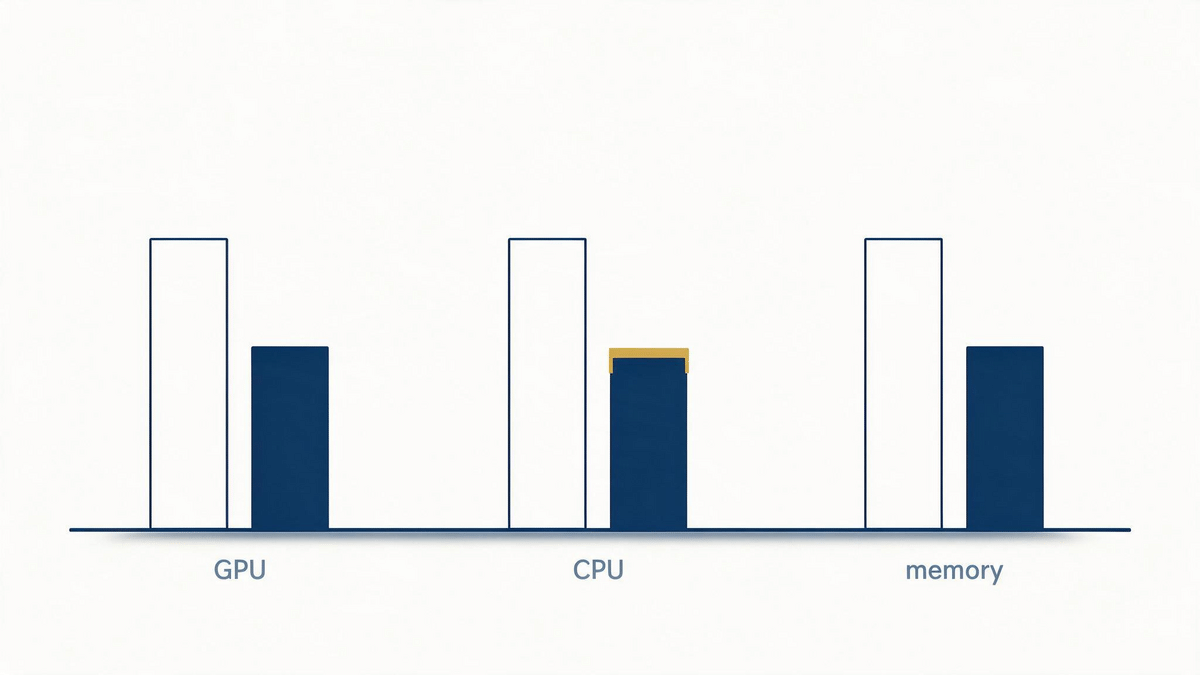
The same arithmetic used on benchmark reports applies to running clusters and is just as decisive. Reservation against measured usage is a utilization law statement: nodes reported full at 30 to 50 percent real CPU usage is not a scheduling mystery, it is twice the reservation the workload demands. GPU nodes billed per hour at 30 to 50 percent utilization on I/O waits are a storage problem wearing a compute invoice.
Before any platform purchase, I pull three numbers per pool (reserved, used, billed) and reconcile them the way Little’s law reconciles a report. Every gap is either a fix (right-sizing, overcommit, caching, scheduling) or a decision to pay for headroom deliberately.
Engine choice as evidence
Engine replacement is where benchmark discipline earns its keep, because the headline numbers are large and the caveats are small print. The evaluation protocol that held up on a recent engine review: require reproducible public benchmarks (the Rust engine reimplementation of Spark ran at one-fifth to one-sixth of plain Spark’s time on a 43-query analytical suite, with a median per-query speedup around eightfold).
Demand resource-efficiency metrics alongside speed (peak memory roughly halved, shuffle spill at zero against over a hundred gigabytes), assess maturity explicitly (distributed mode newer, streaming partial, whole API families unsupported), keep the migration reversible through the Spark Connect protocol, and treat the vendor’s cost reduction as an assumption-laden best case to verify on your own workload. The worked review with all its caveats is the Sail deep dive.
From benchmark to hardware sizing
Translation is the step most reports skip. A fitted scaling curve becomes cluster-size arithmetic: find the peak of the universal scalability law and buy below it. A latency budget becomes per-pool concurrency: distribute the in-flight population across the hops and find the pool that cannot hold its share.
A strong-scaling result becomes honest purchase language: speedup and capacity scaling are separate claims, and efficiency (speedup over workers) is what a12x result on 32 workers is really saying. And a benchmark that survives the filters becomes a sizing input only after it has been rerun on your workload shape, with your failure modes. The recovery path deserves the same treatment as the happy path: exercise the restore and the degraded states, not only the throughput curve.
The review sequence
The ordered workflow this all collapses into. First, check the report’s claims: run Amdahl and Little’s law against the published numbers and discard what cannot be true. Second, audit the platform’s own utilization against reservations in every pool (GPU, CPU, memory, connections) and split the gaps into fixes and deliberate headroom. Third, benchmark the workloads you actually run, including an I/O-pressure suite and the recovery path, before committing hardware or swapping engines.
Fourth, size and buy with the fitted curves and the per-pool concurrency arithmetic. When a platform decision rests on these numbers, a data infrastructure audit or a capacity planning engagement is where I pressure-test them.
FAQ
How do I check a scaling claim in five minutes?
Run it backwards through Amdahl’s law: compute the serial fraction the claimed speedup implies at the claimed worker count (the Karp-Flatt metric), then compare that fraction with the pipeline’s actual stages. Below 10 percent and stable across sizes, the claim is credible and has a ceiling you can name. Above it or rising with the cluster, the bottleneck is coordination and more hardware will not help.
Why do my throughput, latency and concurrency numbers not add up?
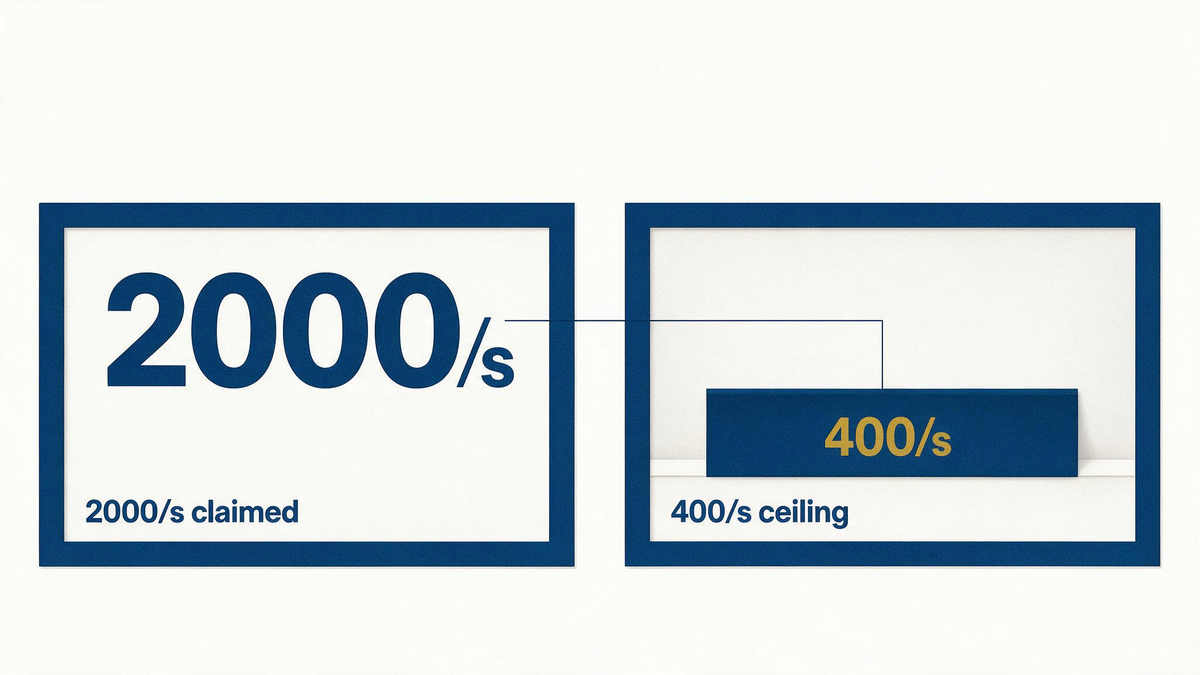
Because Little’s law binds all three within one boundary and one interval, and the report is almost certainly mixing them. The classic signature: a closed-loop generator with 20 clients and 50 ms response time cannot exceed 400 requests per second, so anything faster means the latency was service time, the concurrency was misreported, or the numbers come from different windows.
Where does GPU budget usually leak?
Three places: data-pipeline starvation (GPUs waiting on storage, typically 30 to 50 percent utilization, fixed with caching and prefetch), inference overprovisioning (memory reserved for a worst case that rarely comes, fixed by sizing on a measured request distribution), and scheduler-level reservation waste (whole GPUs requested and half used, fixed with fractional sharing or multi-instance GPUs). Audited together they account for the 35 to 60 percent overspend range.
Should we switch to a faster engine?
Only after the claim survives two checks and one test. The claim must be reproducible on a public benchmark, the resource efficiency (memory, spill) must be reported alongside speed, and the behavior must hold on your own workload in at least two benchmark regimes, including I/O pressure. Keep the migration reversible and treat vendor cost reductions as assumptions to verify, not facts to buy.
Related posts
- Benchmark best practices, part 1: Amdahl’s law caps your scaling claim
- Benchmark best practices, part 2: Little’s law ties throughput, latency and concurrency together
- Why your GPU infrastructure costs 40 percent more than it should
- GPUs changed everything: storage is the bottleneck again
- Spark on Kubernetes reserves CPU it never uses
- Apache Spark smoke tests on Kubernetes
- Sail: when Apache Spark meets Rust, a practitioner’s deep dive
If a scaling claim or a cost line is about to drive a purchase, the capacity planning and platform sizing engagement translates the evidence into hardware. A data infrastructure audit or a focused Expert Call is the usual starting point.
0 Comments