Download this article (PDF) 526 KB
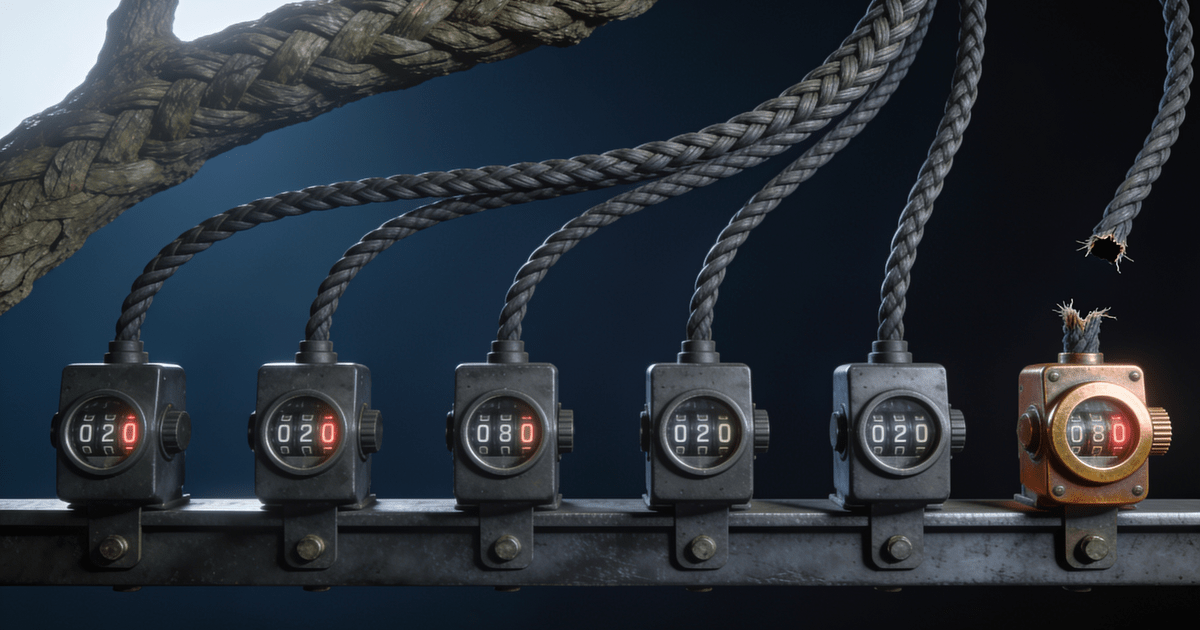
Update, September 2026: the counters this post dissects are now wired up and the loop behind the 405 storm has a fix path in the Silo fork. The full convergence story: how the Silo fork fixed the delete-marker replication loop. Replication health nobody can see is one of the first defects I look for in an independent MinIO review: MinIO, S3 and object storage consulting.
Last week I spent a while reading replication counters on a MinIO cluster that looked unhealthy. The load balancer error rate was climbing. The replication backlog gauge was climbing. The MinIO logs were quiet.
That combination gets misread constantly, usually as “the target is failing”. So I stopped guessing and read the source. Three of the signals an operator naturally reaches for during a replication incident do not mean what they look like, and the one number that would actually tell you something is never read by any code path in the product.
Everything below is verified against minio/minio at commit 7aac2a2c5, the current state of the community repository. Line references come from that tree.
The short version
The short version is that three replication signals do not mean what they look like and one useful counter is never read. A 405 on s3.HeadObject during delete-marker replication is the success path. A 429 retried by the client library never reaches MinIO metrics or logs. Worker-queue overflow under the default replication_priority=auto logs nothing, and droppedCount_since_uptime is always zero.
- A 405 from
s3.HeadObjectduring delete-marker replication is the success path, not a failure. Exclude it from replication error rates. - A 429 from the target is retried up to 10 times for HEAD by the client library, and never reaches MinIO’s own metrics or logs if a retry succeeds. Your proxy is the only place it is visible.
- When every replication worker for a shard is busy, the object is pushed to the MRF retry queue instead of being replicated. Under the shipped default
replication_priority=auto, that overflow logs nothing at all. droppedCount_since_uptimeis incremented in four places in the source and read in none. It reports 0 forever, and no Prometheus metric exposes it. Do not alert on it.recent_backlog_countis the size of the last five-minute MRF flush. It cannot separate an object that failed an attempt from one that was never attempted.
A 405 on HeadObject is the success path
A 405 on s3.HeadObject in replication traffic is the good outcome: the delete marker already reached the target, and MinIO marks the operation Completed. Before the source removes a delete marker on the target, it HEADs that version first. From cmd/bucket-replication.go:
toi, err := tgt.StatObject(ctx, tgt.Bucket, dobj.ObjectName, minio.StatObjectOptions{
    VersionID: versionID,
    Internal: minio.AdvancedGetOptions{
        ReplicationProxyRequest:           "false",
        IsReplicationReadyForDeleteMarker: true,
    },
})
serr := ErrorRespToObjectError(err, dobj.Bucket, dobj.ObjectName, dobj.VersionID)
switch {
case isErrMethodNotAllowed(serr):
    // delete marker already replicated
    if dobj.VersionID == "" && rinfo.VersionPurgeStatus.Empty() {
        rinfo.ReplicationStatus = replication.Completed
        return rinfo
    }
S3 answers a HEAD on a delete marker version with 405 Method Not Allowed. That is standard behavior, not a MinIO quirk. MinIO then uses it as the “already replicated” signal and marks the operation Completed.
So a 405 on s3.HeadObject in replication traffic is the good outcome. It means the delete marker reached the target. Your load balancer still counts it as a 4xx. mc admin trace --errors still prints it, because that flag shows every non-2xx. If you have an error-rate SLO on the endpoint that receives replication traffic, delete-heavy workloads will burn it with successes.
You can separate replication traffic from client traffic at the proxy. MinIO stamps a distinct User-Agent on every outbound replication call, in cmd/bucket-targets.go:
api.SetAppInfo("minio-replication-target", ReleaseTag+" "+tcfg.Arn)Capture that header in HAProxy and put replication on its own error-rate panel. Mixing it with client traffic makes both unreadable.
The 429 you never see
A 429 from the target is retried by the client library and can disappear entirely: if a retry succeeds, nothing reaches MinIO’s own metrics or logs. MinIO drives replication through minio-go. In v7.0.91, retry.go sets MaxRetry = 10 and lists HTTP 429 among the retryable status codes. Your proxy is the only place the throttle is visible.
That retry loop can only replay a request whose body it can rewind. A HEAD has no body, so StatObject gets the full ten attempts. A streamed object PUT cannot be replayed, so it fails out to the caller and gets recorded.
The practical result: your target can be throttling hard, and the source reports nothing at all, as long as the retries eventually succeed. There is no metric and no log line for a retried 429. The load balancer knows. MinIO does not tell you. If throttling is what is slowing your replication down, the only place that fact exists is the proxy log.
The queue overflow that logs nothing under the default priority
Under the shipped default replication_priority=auto, a worker-queue overflow logs nothing at all: the object is pushed to the MRF retry queue instead of being replicated now. That silence is the reason a cluster can show climbing counters with quiet MinIO logs. Here is queueReplicaTask, the function that hands an object to a replication worker:
select {
case <-p.ctx.Done():
case healCh <- ri:
case ch <- ri:
default:
    globalReplicationPool.Get().queueMRFSave(ri.ToMRFEntry())
    p.mu.RLock()
    prio := p.priority
    maxWorkers := p.maxWorkers
    p.mu.RUnlock()
    switch prio {
    case "fast":
        replLogOnceIf(GlobalContext, fmt.Errorf("Unable to keep up with incoming traffic"), ...)
    case "slow":
        replLogOnceIf(GlobalContext, fmt.Errorf("Unable to keep up with incoming traffic - ..."), ...)
    default:
        // resize the worker pool. no logging.
    }
}
The default: arm of the select fires when the worker channel is full. The object is pushed into the MRF queue instead of being replicated now.
Look at what happens next. Under replication_priority=fast or slow, you get a warning, and replLogOnceIf deduplicates it so you get one line per hour no matter how many objects overflow. Under auto, which is the shipped default in internal/config/api/api.go, the code grows the worker pool and logs nothing.
So on a default-configured cluster, sustained worker-queue overflow produces exactly zero log output. That alone explains the “climbing counters, quiet logs” pattern I started with.
Setting replication_priority, and what it costs you
The setting lives in the api config subsystem, so it is one command from any node against the cluster, not a per-node edit:
# what is in effect right now
mc admin config get myminio api replication_priority replication_max_workers

# switch away from auto
mc admin config set myminio api replication_priority=fast

# back to the shipped default
mc admin config reset myminio api replication_priority
api is one of the dynamic subsystems, so this applies in place. The admin handler calls applyDynamic, which loads the new config locally and then calls globalNotificationSys.SignalConfigReload, and each peer re-reads it and runs ResizeWorkerPriority against the live pool. No restart, no rolling anything, and the value is persisted in the config store so it survives one. Read it back before you trust it.
The environment variable wins. If your deployment sets MINIO_API_REPLICATION_PRIORITY, through a systemd EnvironmentFile, a Compose environment: block or an operator-managed StatefulSet, the config store is dead weight for that key. The loader is env.Get(EnvAPIReplicationPriority, kvs.GetWithDefault(...)), which returns the environment value whenever one exists. The mc command above will report success and change nothing. Edit the environment and restart instead. The same holds for MINIO_API_REPLICATION_MAX_WORKERS.
The priority is a pool size first and a logging switch second. Picking a value picks both, and you cannot have one without the other:
| Value | Workers per node | MRF workers | Overflow logged |
|---|---|---|---|
fast | 500, fixed | 8 | Yes |
slow | 50, fixed | 2 | Yes, with a message telling you to switch to auto |
auto (default) | Starts at 100, plus one per overflow event up to the cap. Never shrinks. | 4, same ratchet up to 8 | No |
All of those numbers are then clamped by replication_max_workers, which defaults to 500 and is rejected outside the range 1 to 500. There is a separate replication_max_lrg_workers for transfers of 128 MiB and above, default 10, range 1 to 10. If you find replication_workers or replication_failed_workers in your config or in an older guide, drop them: both are in deletedSubSysKeys and are stripped from the config on load, so a value carried over from an older deployment does nothing at all.
That clamp is the useful part. If you want the warning without pinning 500 workers per node, set both keys in one call:
mc admin config set myminio api replication_priority=fast replication_max_workers=100NewReplicationPool and ResizeWorkerPriority both apply if maxWorkers > 0 && workers > maxWorkers before sizing anything, so that combination gives you a fixed pool of 100, which is exactly where auto starts, plus the log line auto refuses to emit. What you give up is the ratchet: under sustained pressure auto would have grown that pool toward 500 on its own. So choose the number you are willing to live with as a ceiling under load, not the one that looks comfortable at idle. If replication competing with client traffic is the real worry, slow is the honest setting: 50 workers, 2 MRF workers, same warning.
Read the slow-mode message before you act on it. It is Unable to keep up with incoming traffic - we recommend increasing replication priority with mc admin config set api replication_priority=auto. Follow that advice and you raise the worker ceiling and turn the warning off in the same command.
What the warning is worth once you have it. It is deduplicated, not rate limited. replLogOnceIf keys on the string replication and suppresses any repeat of an identical error until a background routine wipes the map, which it does once an hour. A node overflowing continuously prints one line an hour. The suppressed occurrences are counted in memory and never exposed anywhere, so the line tells you that overflow happened in that hour and nothing about how much. There is a second-order effect worth knowing: the dedup key is the whole replication subsystem rather than the message, so whichever replication error arrives first in an hour holds the slot, and every other replication error that follows logs on each occurrence. Depending on what else went wrong first, the same overflow can be one line an hour or a flood.
Then confirm it end to end on a cluster that is actually overflowing: set the priority, wait for a period you know produced a rising recent_backlog_count, and grep whatever collects your server logs, mc admin logs, journald or the container log, for keep up with incoming traffic. If the backlog moved and that string never appeared, the environment variable is overriding you.
Overflow is per shard, not per pool
Worker selection is a hash, not a least-loaded pick:
func (p *ReplicationPool) getWorkerCh(bucket, object string, sz int64) chan<- ReplicationWorkerOperation {
    h := xxh3.HashString(bucket + object)
    ...
    return p.workers[h%uint64(len(p.workers))]
}
Each of those channels is created with a 10000-entry buffer in ResizeWorkers. The default auto pool starts at 100 workers per node and grows to a 500 cap.
Because assignment is by hash of bucket plus object name, a hot prefix concentrates on a small number of shards. One shard can hit its 10000 limit and start overflowing while the pool as a whole looks idle and ActiveWorkers stays low. Aggregate worker utilization will not show you this.
One detail worth noting while you are in this function. The signature is (bucket, object string), and the delete path calls it correctly as getWorkerCh(doi.Bucket, doi.ObjectName, 0). The object path calls it as getWorkerCh(ri.Name, ri.Bucket, ri.Size), where Name is the object and Bucket is the bucket. The arguments are reversed. Both orders are deterministic and distribute fine, so throughput is unaffected, but hashing by object plus bucket in one path and bucket plus object in the other means a given object’s writes and its delete marker land on different shards. If the per-object hash was meant to give operations on one object worker affinity, it does not do that across the two paths.
droppedCount_since_uptime is always zero
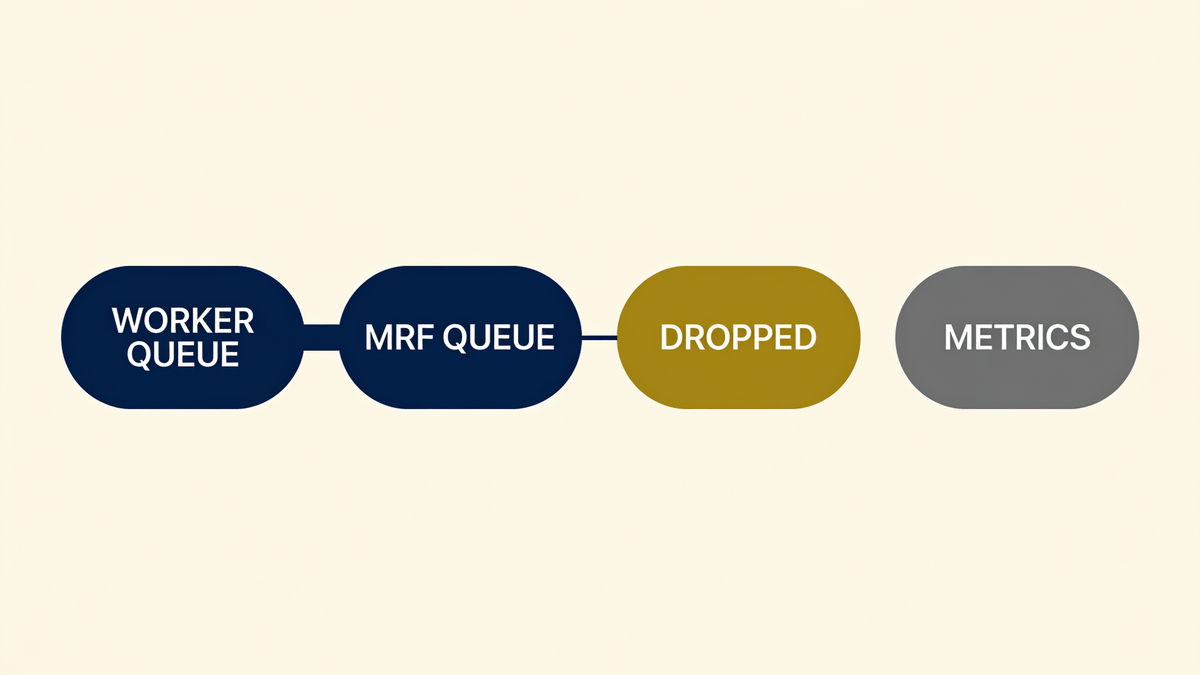
droppedCount_since_uptime is incremented in four places in the source and read in none, so it reports 0 forever and no Prometheus metric exposes it. Overflowed objects go to queueMRFSave, and that function drops them on the floor in two cases. Do not alert on this counter: the number that would tell you MinIO gave up on an object never leaves the process.
func (p *ReplicationPool) queueMRFSave(entry MRFReplicateEntry) {
    if !p.initialized() {
        return
    }
    if entry.RetryCount > mrfRetryLimit { // let scanner catch up if retry count exceeded
        atomic.AddUint64(&p.stats.mrfStats.TotalDroppedCount, 1)
        atomic.AddUint64(&p.stats.mrfStats.TotalDroppedBytes, uint64(entry.sz))
        return
    }
    ...
        select {
        case p.mrfSaveCh <- entry:
        default:
            atomic.AddUint64(&p.stats.mrfStats.TotalDroppedCount, 1)
            atomic.AddUint64(&p.stats.mrfStats.TotalDroppedBytes, uint64(entry.sz))
        }
}
Either the object has already been retried more than mrfRetryLimit (which is 3), or the MRF save channel itself is full at its 100000 cap. Either way the entry is discarded and a counter goes up.
Now grep the whole repository for that counter:
$ grep -rn "TotalDroppedCount\|TotalDroppedBytes" --include=*.go . | grep -v _gen
cmd/bucket-replication.go:3545:  atomic.AddUint64(&p.stats.mrfStats.TotalDroppedCount, 1)
cmd/bucket-replication.go:3546:  atomic.AddUint64(&p.stats.mrfStats.TotalDroppedBytes, uint64(entry.sz))
cmd/bucket-replication.go:3559:  atomic.AddUint64(&p.stats.mrfStats.TotalDroppedCount, 1)
cmd/bucket-replication.go:3560:  atomic.AddUint64(&p.stats.mrfStats.TotalDroppedBytes, uint64(entry.sz))
cmd/bucket-replication-metrics.go:325: TotalDroppedCount uint64 `json:"droppedCount_since_uptime"`
cmd/bucket-replication-metrics.go:327: TotalDroppedBytes uint64 `json:"droppedBytes_since_uptime"`
Four writes. A struct definition. Zero reads.
The two places that build a ReplicationMRFStats for anything outside the process are getNodeQueueStats and getNodeQueueStatsSummary in cmd/bucket-stats.go. Both look like this:
qs.MRFStats = ReplicationMRFStats{
    LastFailedCount: atomic.LoadUint64(&r.mrfStats.LastFailedCount),
}
Only LastFailedCount is copied. The two dropped fields keep their Go zero value. So droppedCount_since_uptime and droppedBytes_since_uptime report 0 in the admin API no matter how many objects were actually thrown away, and there is no Prometheus metric for them in metrics-v2.go or any metrics-v3 file either.
These are write-only counters. The single number that tells you MinIO gave up on replicating an object never leaves the process.
A correction to my own earlier writing while I am here. In MinIO Site Replication: Sync Mode Will Not Save Your RPO I wrote that overflowing entries are “dropped silently, counted in TotalDroppedCount”. The first half was right and the second half was too generous. They are counted into a field nobody reads.
What recent_backlog_count actually measures
There is one MRF number that does get exported, and its internal name invites a misreading. The builder function is called getClusterReplMRFFailedOperationsMD, but the metric it produces is recent_backlog_count, described as “Total number of objects seen in replication backlog in the last 5 minutes”. It is fed from MRFStats.LastFailedCount, which saveMRFEntries sets to the number of entries in the last flush to disk.
So it is a sample of the size of the most recent five-minute MRF flush. It is not a failure count, and it is not a queue depth. Objects that merely overflowed a worker channel and were never attempted land in it alongside objects that genuinely failed against the target. The metric cannot tell you which you have.
| Signal | What it actually means | What it will not tell you |
|---|---|---|
405 on s3.HeadObject | Delete marker already present on target. A success. | Nothing is wrong. Exclude it from replication error rates. |
| 429 at the proxy | Target is throttling. Retried up to 10 times for HEAD. | Invisible in MinIO metrics and logs if a retry succeeds. |
| Quiet replication logs | Under default auto priority, overflow logs nothing. | Silence is not health. |
recent_backlog_count | Size of the last 5 minute MRF flush. | Cannot separate real failures from never-attempted overflow. |
total_failed_count | Attempts that came back failed. | Excludes objects dropped before any attempt. |
droppedCount_since_uptime | Always 0. Never populated. | Everything. Do not build an alert on it. |
Why this matters for your RPO
Why this matters for your RPO: a dropped MRF entry is not lost data, but its recovery time stops being a retry interval and becomes a full namespace scan. The object is intact on the source, still carrying its PENDING marker in its own xl.meta. What is lost is the fast path back. That is the number your RPO statement needs and the one you cannot currently observe.
The comment in the code says it plainly: “let scanner catch up if retry count exceeded”. Once an entry is dropped, nothing re-queues it on a timer. It waits for the background scanner to walk past it, or for a client to happen to GET or HEAD it. Your recovery time for that object stops being a retry interval and becomes a full namespace scan.
That is the number that belongs in your RPO statement, and it is the number you cannot currently observe. You can measure how many objects failed an attempt. You cannot measure how many were pushed onto the slow path without one. On a cluster with hundreds of millions of objects, the difference between those two figures is the difference between a credible DR commitment and a guess. I went through the rest of that model in the site replication post.
How I monitor MinIO replication now
I monitor MinIO replication at the proxy and on the counters that actually move, because the default metrics cannot show a retried 429 or a dropped MRF entry. Split replication traffic from client traffic at the proxy, exclude the 405 success path from error alerting, and treat recent_backlog_count as a pressure gauge rather than a failure count. The list below is the working setup.
- Split replication traffic from client traffic at the proxy, keyed on the
minio-replication-targetUser-Agent. Give each its own error-rate panel. - Exclude 405 on HeadObject from replication error alerting. Alert on its absence changing sharply instead, which tracks delete volume.
- Alert on 429 at the proxy, not in MinIO. It is the only place a retried throttle is visible.
- Treat
recent_backlog_countas a pressure gauge, not a failure count. A sustained non-zero value means the worker pool is not keeping up, whatever the logs say. - Set
replication_priorityaway fromautoif you want overflow in your logs at all.mc admin config set myminio api replication_priority=fast replication_max_workers=100keepsauto‘s starting pool size and adds the warning it will not emit. You trade the automatic pool growth for one log line an hour. On a cluster where DR commitments are real, I take the warning. - Watch per-object replication status directly for a sampled set of keys. It is the only ground truth that does not go through the aggregate counters.
- Track scanner cycle time. It is the actual recovery bound for anything that got dropped.
The part that will not be fixed
The write-only counter behavior will not be fixed, because the community edition is source-only now and MinIO points users at AIStor. This is not a bug report waiting on a fix: the accounting behavior is what you own, permanently, and your monitoring has to compensate. The README of the repository these lines come from now opens with this:
THIS REPOSITORY IS NO LONGER MAINTAINED.
The community edition is source-only now, with no pre-compiled releases, and MinIO points users at AIStor. So this is not a bug report waiting on a fix. If you run community MinIO in production, this accounting behavior is what you own, permanently, and your monitoring has to compensate for it rather than wait it out.
That is a reasonable position for MinIO to take commercially. It does change the calculus for anyone whose DR plan rests on replication counters they have never read the source behind. Two of the three signals in my opening paragraph were noise. The one that would have been signal is hardcoded to zero.
Frequently asked questions
Does a 405 on HeadObject mean MinIO replication is failing?
No. Before removing a delete marker on the target, the source HEADs that version. If the delete marker is already there, S3 semantics require a 405 Method Not Allowed, and MinIO reads that 405 as “already replicated” and marks the operation complete. It is the success path. A replication error-rate panel that counts every non-2xx will show a 405 rate that tracks your delete volume and means nothing else.
Why are my MinIO replication logs empty while the backlog keeps growing?
Because of the default. When a shard’s worker channel is full, MinIO pushes the object onto the MRF retry queue and moves on. Only the fast and slow replication priority modes emit a log line for that; auto, which is what ships, emits none. Silence in the replication logs is not evidence that replication is healthy, it is the documented behavior of the mode you are almost certainly running.
How do I set replication_priority in MinIO?
mc admin config set myminio api replication_priority=fast, or slow. api is a dynamic subsystem, so the change applies across the cluster with no restart and is persisted in the config store. Two things catch people out. If the deployment sets MINIO_API_REPLICATION_PRIORITY in the environment, that value overrides the config store and the command changes nothing. And the priority sets the worker pool size, not only the logging: fast pins 500 workers per node, slow pins 50, both clamped by replication_max_workers. Setting replication_priority=fast replication_max_workers=100 in one call keeps the pool size auto starts with and switches the overflow warning on.
What does recent_backlog_count measure in MinIO?
The size of the most recent MRF flush, over a five-minute window. It is a pressure gauge: a sustained non-zero value means the worker pool is not keeping up. It is not a failure count, and it cannot tell you whether an entry got there by failing a replication attempt or by never being attempted at all. Those two have very different recovery times, and this metric collapses them into one number.
Why is droppedCount_since_uptime always 0?
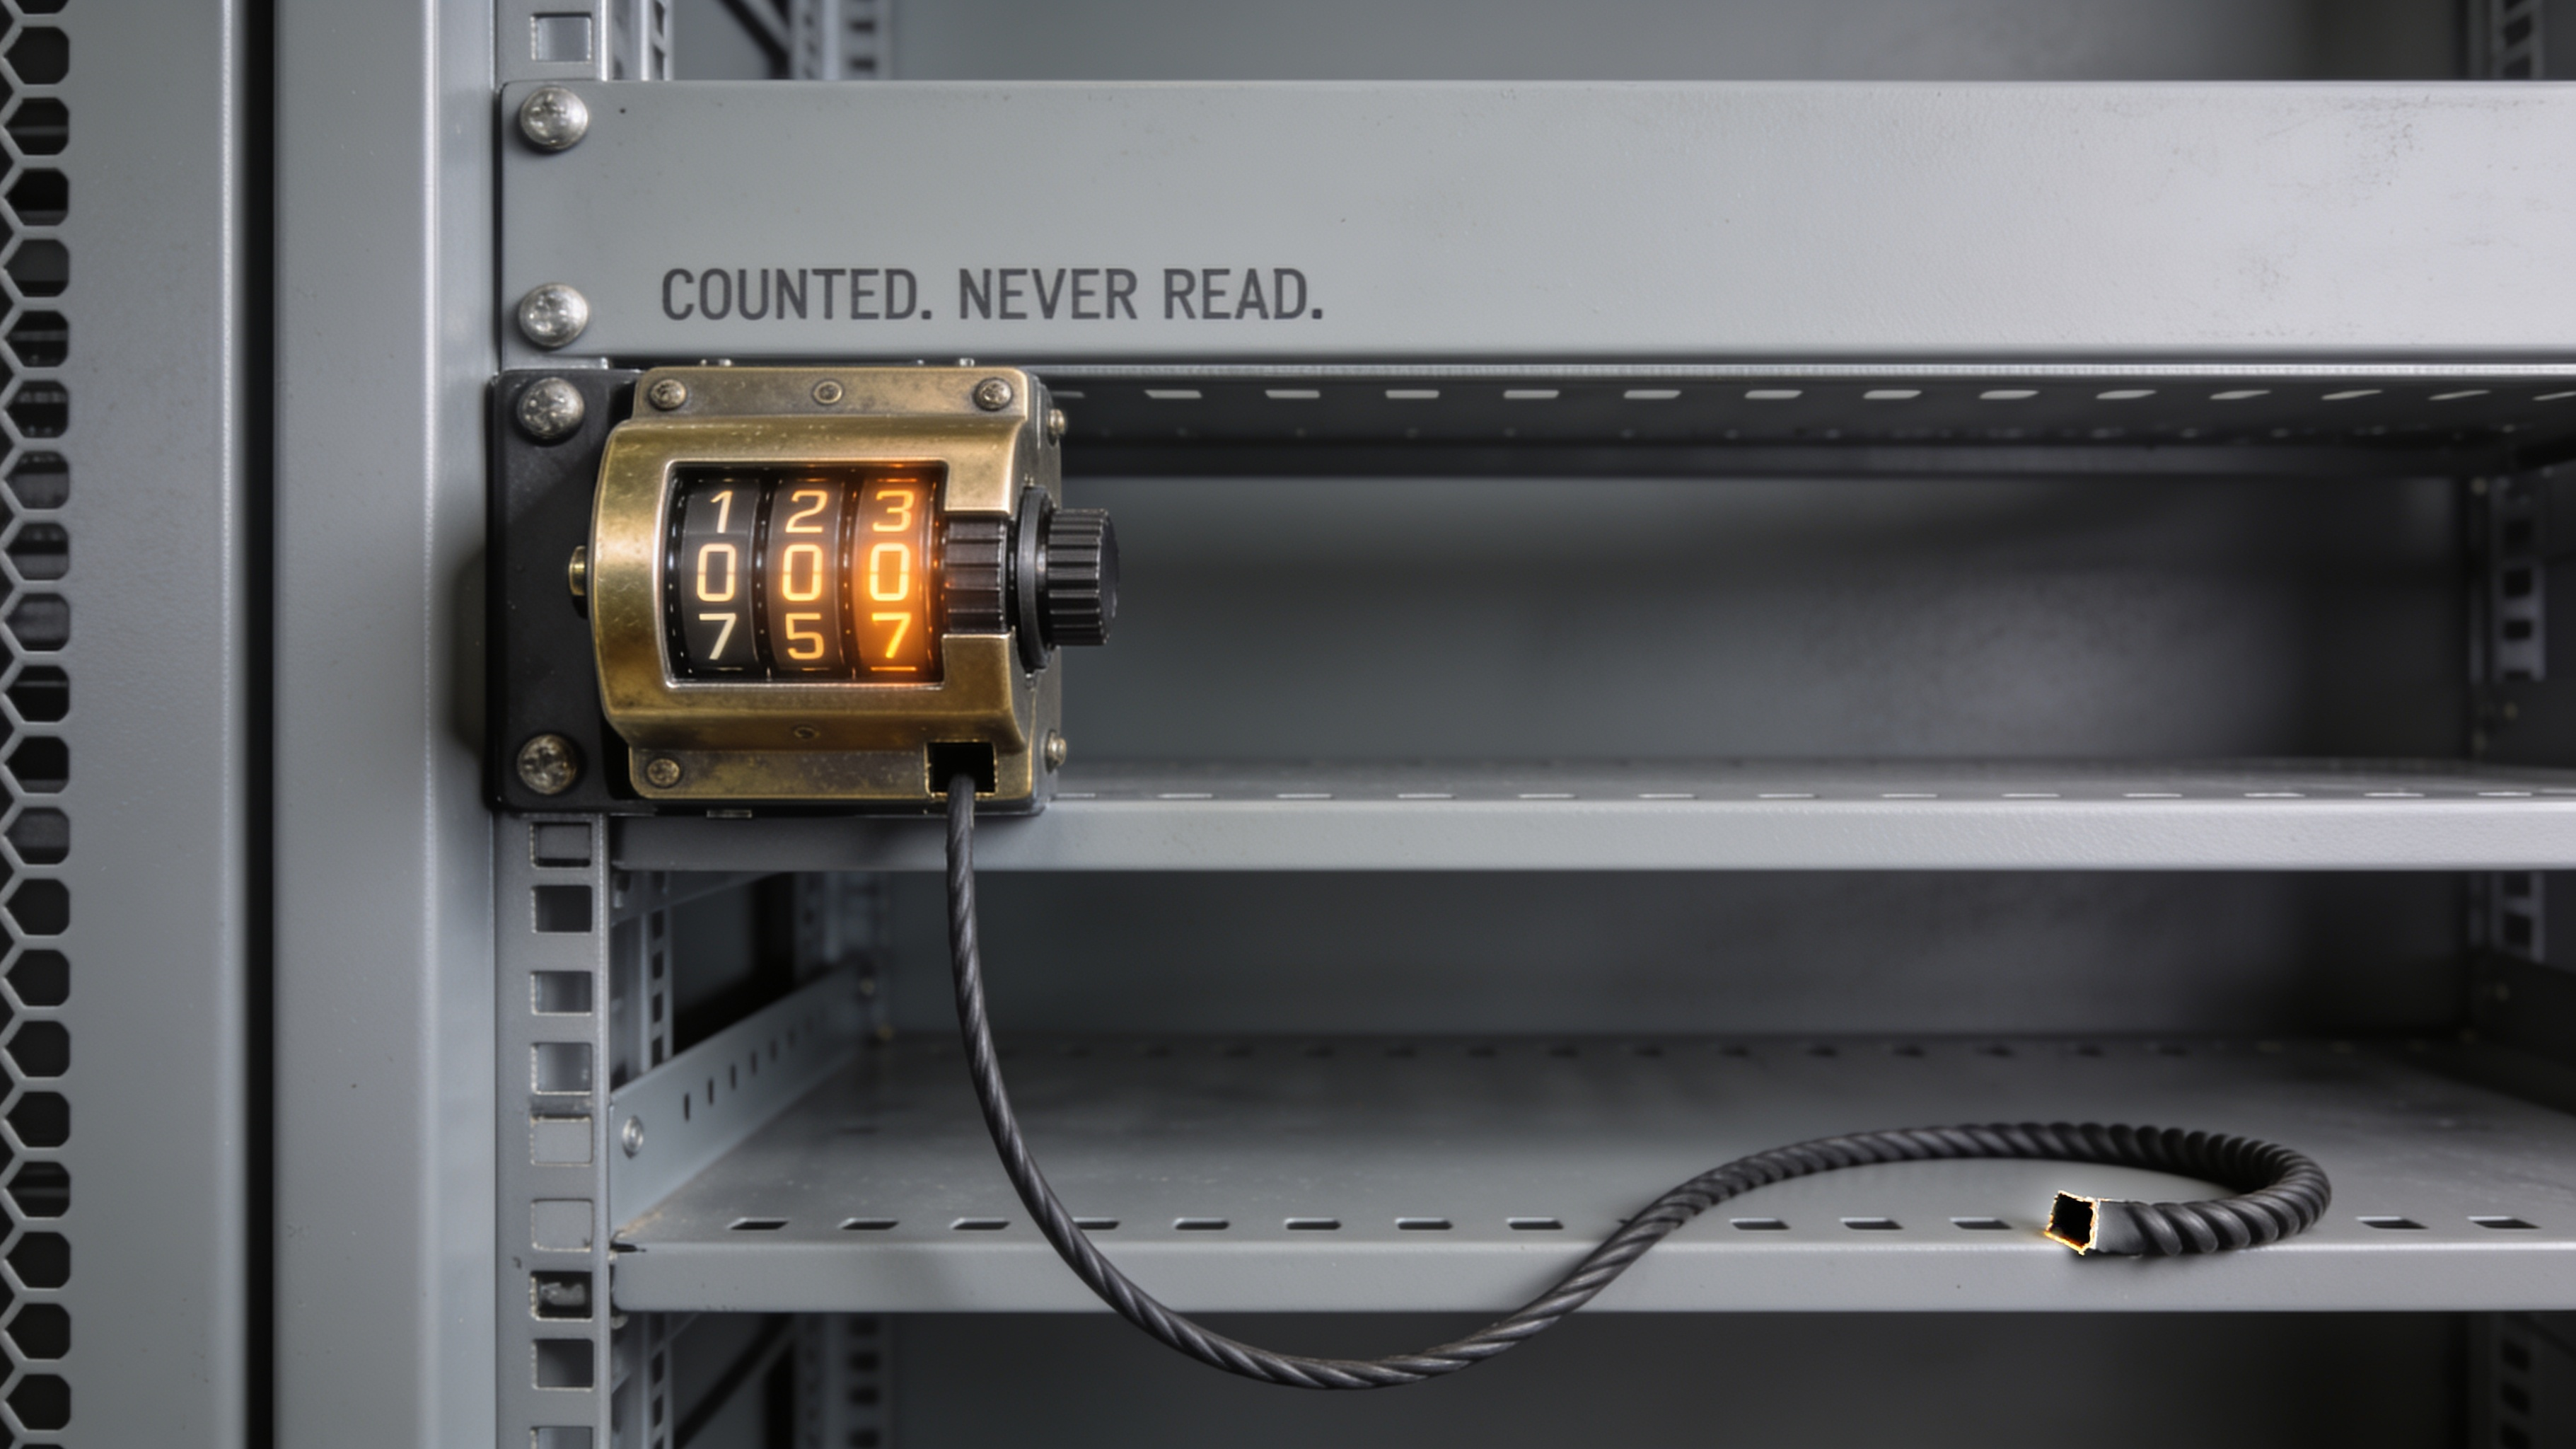
Because nothing reads it. The counter is incremented correctly in the replication path, but both code paths that build the exported queue statistics populate only LastFailedCount and leave the dropped fields at their Go zero value. There is also no Prometheus metric wired to it in either metrics-v2 or metrics-v3. The number you would most want during a replication incident is the one number the product never surfaces.
How do I detect objects MinIO dropped from the replication queue?
Not from the aggregate counters. The two things that work are sampling per-object replication status directly for a set of known keys, which is the only ground truth that does not pass through the counters, and tracking scanner cycle time, which is the real recovery bound for anything that was dropped. Alerting on 429s at the proxy and treating recent_backlog_count as a pressure gauge covers the rest.
Update 2026-09-29. This post is now part of Data Platform Resilience: RTO, RPO and Replication in Practice, the field guide to RTO, RPO and replication.
Related posts
- Data Platform Resilience: RTO, RPO and Replication in Practice
- MinIO Site Replication: Sync Mode Will Not Save Your RPO
- MinIO and lots of small files – why object count and the scanner cadence dominate operations, and why the scanner is the real recovery bound for anything dropped.
- MinIO on XFS: Inode Exhaustion and Prefix Design for Lots of Small Files
- MinIO and Small Files: When Erasure Coding Becomes 15x Replication
If your disaster recovery commitments rest on object storage replication you have not verified at this level, that is exactly the kind of gap a resilience and disaster recovery assessment is meant to close. I measure the recovery path rather than reading the dashboard. Book a 15-min intro call if you want to talk through your setup.
0 Comments