Most AI infrastructure teams spend 35 to 60% more on GPU compute than they need to. The cause is not cloud pricing. It is architecture, and it is fixable.
If you run AI workloads in production, you have probably seen the same pattern. GPU costs climb every month. Nobody can explain exactly where the money goes. And every cost-cutting effort starts and ends with “use more spot instances.”
Over the past few months I have reviewed real GPU infrastructure bills across several mid-to-large deployments. The numbers are consistent. They have little to do with cloud provider pricing.
The 35-60% Overspend: Where Does It Come From?
Four structural cost leaks show up in almost every GPU infrastructure I review. Instance type selection and reserved-instance commitments are things most teams already optimize. These four are different. They are architectural patterns that waste compute and storage capacity quietly.
1. Your Data Pipeline Starves the GPUs
This is the single biggest waste I see. A GPU costs $2 to $12 per hour (an H100 in 2026, depending on provider and commitment). When it sits idle waiting for data, you pay for I/O wait. That is the most expensive idle time in the stack.
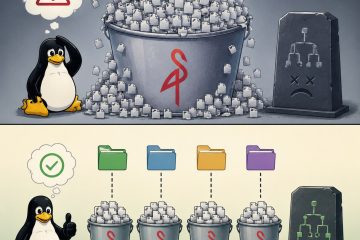
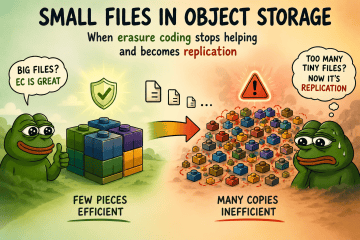
The typical pattern: training data lives on an object store (S3, MinIO, Ceph). The training pod pulls data through a shared filesystem or direct S3 access. When the object store cannot sustain throughput, because of request-rate limits, small-file overhead, or network contention, the GPU pipeline stalls.
I have measured GPU utilization drop to 30-50% on workloads where the data pipeline is I/O-bound. That is not a GPU efficiency problem. It is a storage architecture problem. The GPU pays the price for a data path designed for batch Spark jobs, not streaming AI training.
The fix: Decouple the data-serving path from the general-purpose object store. A local NVMe cache layer (WEKA, Alluxio, JuiceFS, or a CephFS-based tier) that prefetches training batches can recover 15 to 25 percentage points of GPU utilization. That translates directly into 20-40% more throughput from the same GPU fleet.
2. Inference Serving Is Overprovisioned, Often by 2x
Most teams size inference deployments on peak-load math that assumes every request hits the largest model. Real request-size distribution is skewed. 80-90% of requests are small or medium, with occasional large-batch peaks.
Inference frameworks (vLLM, TensorRT-LLM, SGLang) all support request batching and dynamic model placement. The default configurations are conservative. I have seen clusters where 60% of GPU memory on inference nodes is reserved for a worst case that rarely happens.
The fix: Measure the actual request-size distribution and model-memory use over a two-week window. Right-size the GPU allocation per serving pod. Enable dynamic batching. Add request-level queuing to absorb peaks instead of reserving GPU memory for the 99.9th percentile. This alone cuts inference GPU spend by 30-50% on most deployments.
3. Kubernetes GPU Scheduling Is Still Immature
Kubernetes GPU scheduling improved by 2026, but the default assumptions still waste capacity. The standard model, one GPU per pod or a fixed count via nvidia.com/gpu, ignores GPU sharing (MIG, MPS) and fractional allocation.
Teams that run inference and fine-tuning on the same cluster see GPU fragmentation. Pods request whole GPUs, use 30-60% of the compute, and leave the rest idle, because Kubernetes has no native way to sub-allocate a GPU across pods.
The fix: Use MIG partitioning for production (each A100 or H100 splits into up to 7 instances), with node-level tooling that understands workload profiles: the NVIDIA GPU Operator, Volcano gang scheduling, or HAMi for fractional sharing. This can lift cluster-wide GPU utilization from 40% to 70-80% with no application changes.
4. Nobody Charges Workloads for GPU Time
The most basic FinOps practice, showback, is missing from most AI infrastructure I audit. Without per-workload GPU cost attribution, you cannot tell which training job, which model, or which team drives the bill. The result is no feedback loop, no optimization incentive, and high spend that becomes normal.
Tools like OpenCost (CNCF) and Kubecost give per-namespace GPU cost breakdowns. Even a simple labeling convention plus Prometheus metrics gives you the data to start.
The fix: Run GPU cost showback as a two-week project. Label every pod with team, model, and workload-type (training or inference). Export node-level GPU utilization to Prometheus. Build a dashboard that shows GPU-hours per team per week. The visibility alone usually drives a 10-20% reduction within a quarter, with no architectural changes.
The Cumulative Impact
Here is the order of magnitude. For a team spending $100K per month on GPU infrastructure (modest by 2026 standards for a mid-size deployment):
- Fix data pipeline starvation: recover 20-40% throughput from the same GPUs
- Right-size inference allocation: reduce GPU nodes by 30-50%
- Improve Kubernetes GPU scheduling: lift cluster utilization from ~40% to ~70%
- Add GPU showback: drive a 10-20% reduction through visibility alone
These optimizations are not hypothetical. They compound. A team that addresses all four can serve the same workload at 40-60% lower GPU cost, or double its throughput at the same budget.
The 40% in the title is not a marketing number. It is a conservative midpoint of what I see in audits.
Why This Matters for Your Platform Team
GPU cost is not a procurement problem. It is an architecture and operations problem. The teams that fix it treat GPU infrastructure like any other performance-critical system. They measure it end-to-end, they find the bottlenecks, and they align engineering incentives with cost efficiency.
If your GPU bill is growing and you cannot explain the waste, start with a focused review of the four areas above. Most teams recover the cost of an external review in the first month of savings.
About the Author
Julien Laurenceau is an independent expert in data infrastructure, distributed systems and performance engineering. He audits data and AI platforms for CTOs, Heads of Platform and engineering teams, finding the real bottlenecks, reliability risks and cost inefficiencies that standard monitoring misses.
If your GPU infrastructure costs are rising and you want an independent diagnosis, book a free 30-minute scoping call.

0 Comments